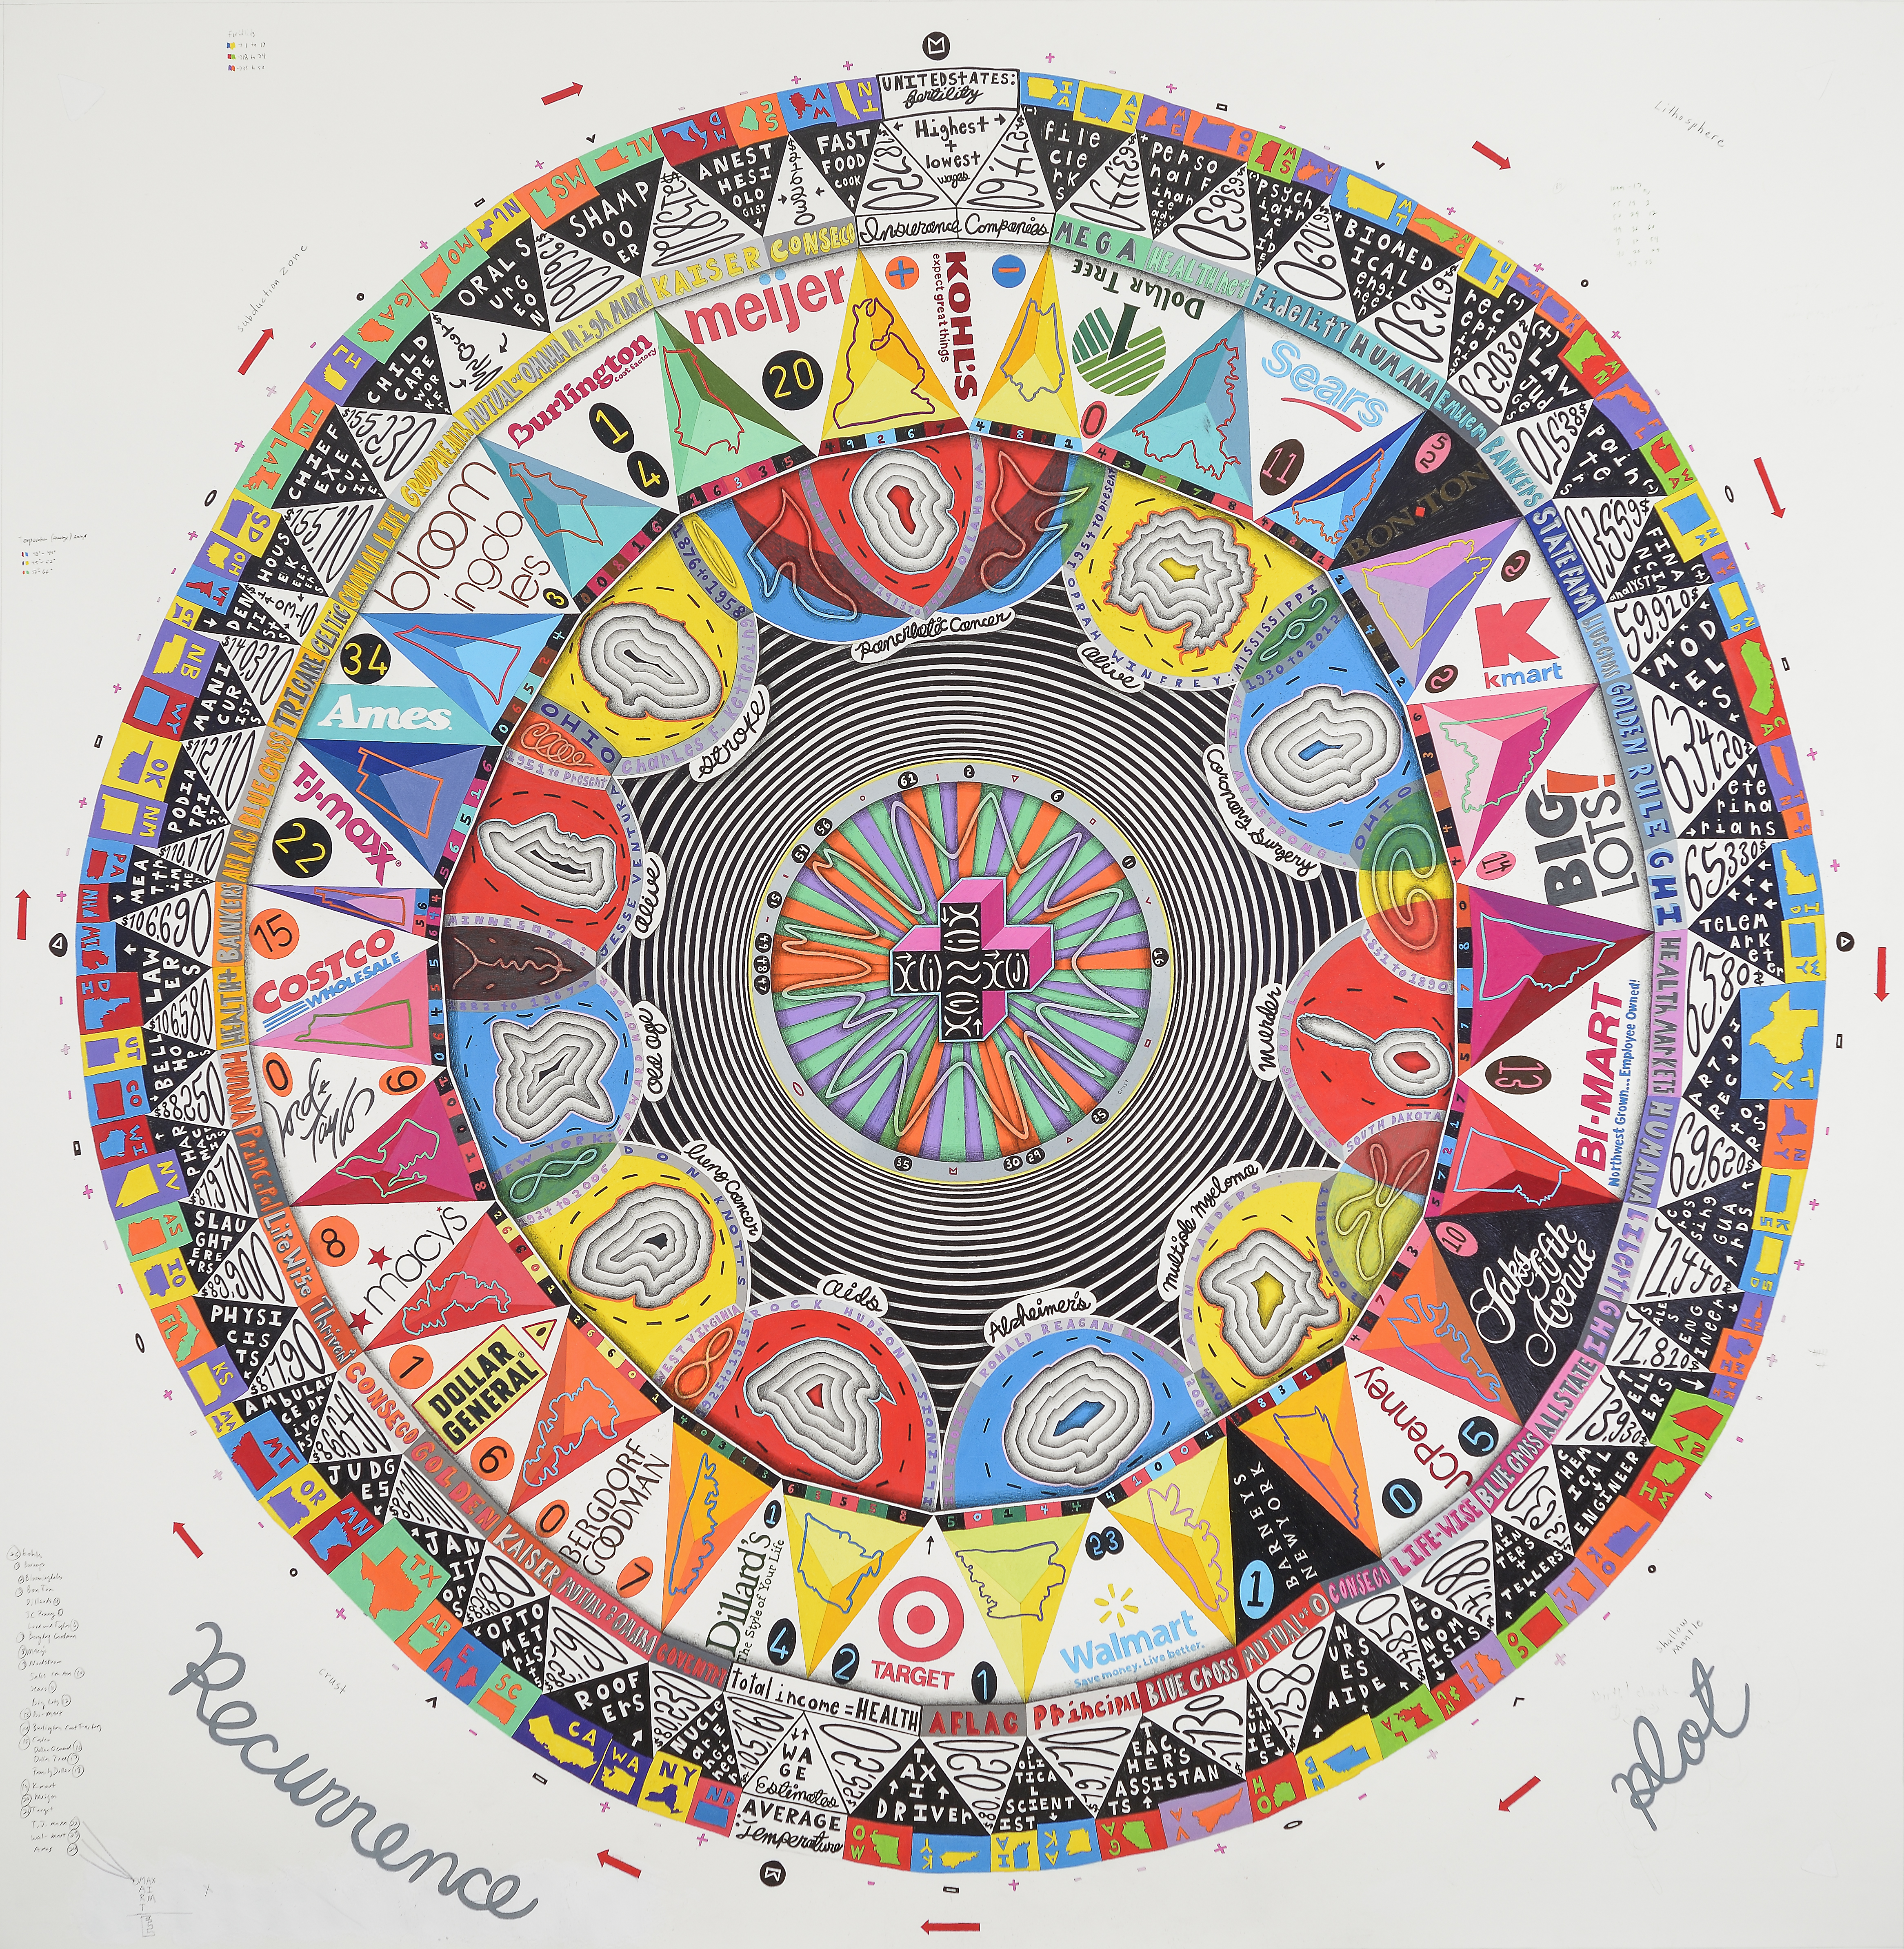
A Recurrence Plot
68 x 56 inches, acrylic, colored pencil and graphite on paper
I superimposed my ideas about Social Class onto the physical layers of Earth. I used the information from each layer, from the crust through to the core, to generate the subsequent layer’s information/form. I saw this as a lifecycle of sorts, from birth to death, infinitely repeated. CRUST: Fertility Rates and Average Yearly Temperature for each US state, color-coded LITHOSPHERE: Average salaries for highest and lowest paid professions, paired SUBDUCTION ZONE: Insurance Companies. I subtracted the previous salary amounts from each other and used this composite amount to determine a company MIDOCEAN RIDGES: Department Stores in the US, ranging from high end to discount SHALLOW MANTLE: Shape of a US State/zip code of specific city – represents the geographic midpoint between the paired corporate headquarters TRANSITION REGION: Portrait of famous resident from the previous state LOWER MANTLE: Cause of death for each celebrity D LAYER: Optical ring transition OUTER CORE: Chance derived, star-like shape and colored bar pattern INNER CORE: Recurrence Plot Graph (in chaos theory, is a plot showing for a given moment in time, the times at which a phase space trajectory visits roughly the same area)