The Body

Chest and Back
55 x 55 inches, acrylic, watercolor, graphite and colored pencil on paper
This work began when I mapped patterns of sun spots, blemishes, scars, and freckles on the front and back of my torso.

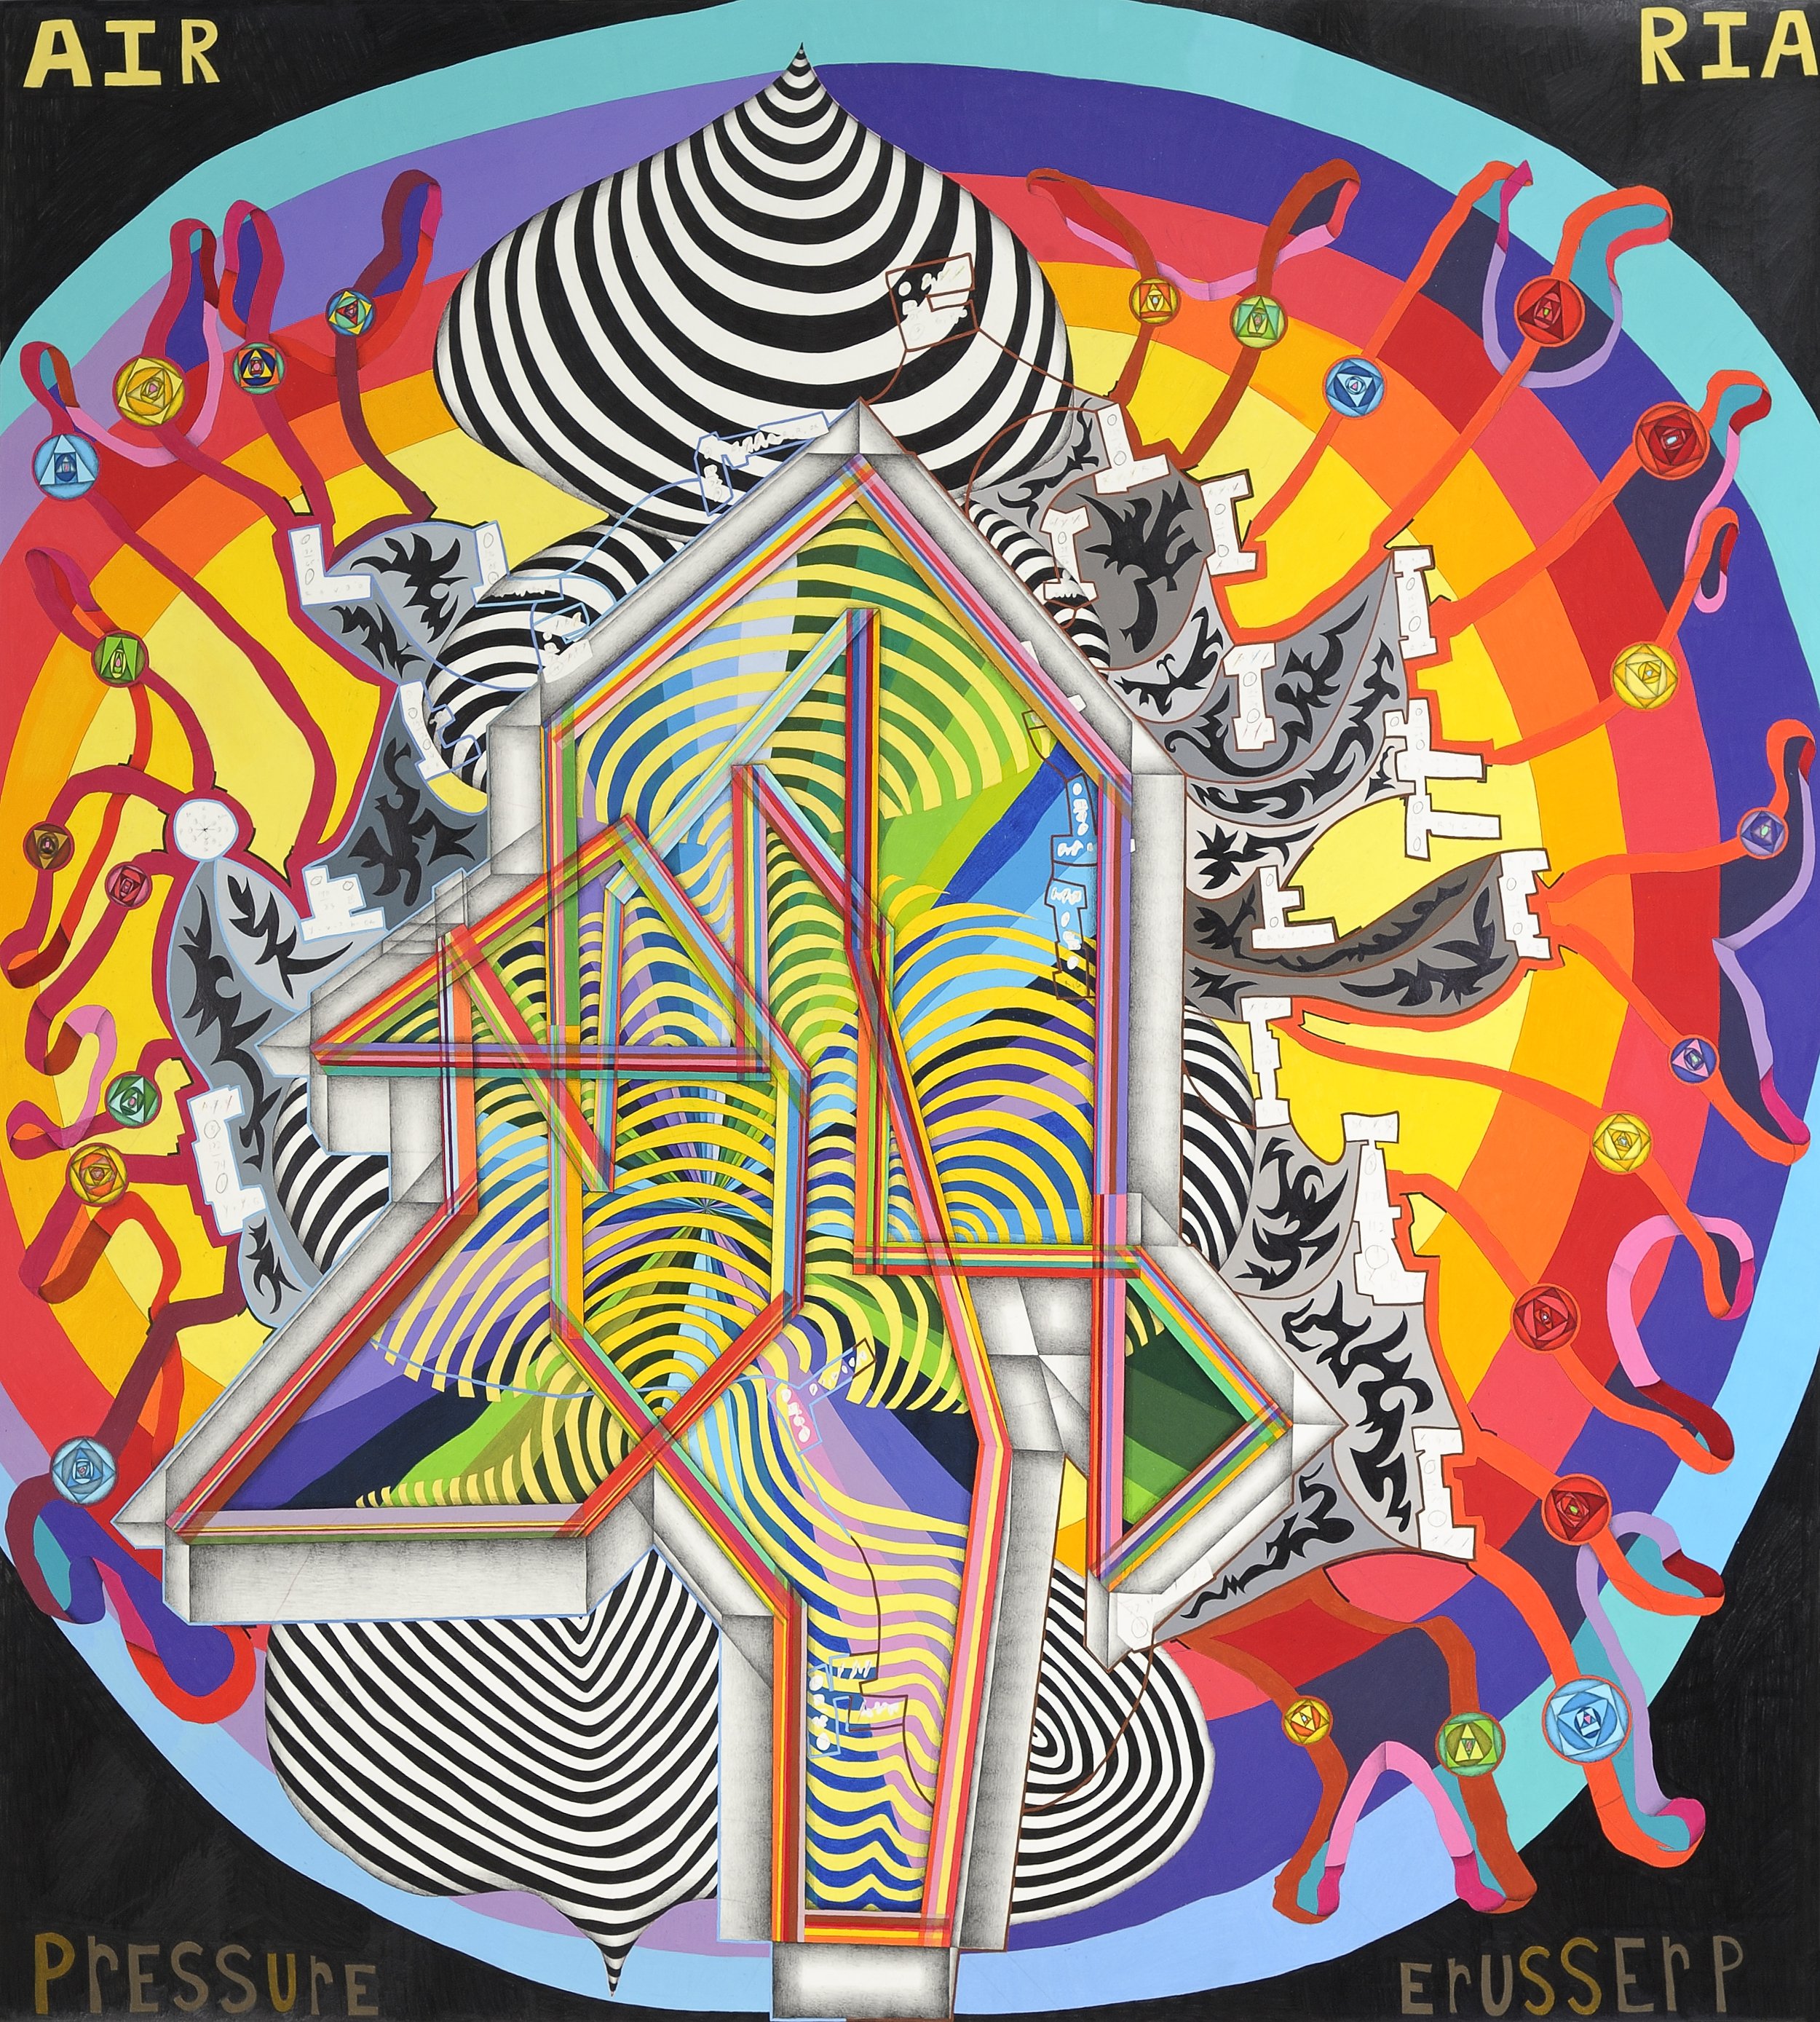
Blood Pressure
77 1/2 x 70 inches, colored pencil and graphite on paper
To generate the multicolored bars in the center of this piece (the core of the work), I recorded my blood pressure each day as I entered the studio. I then invented a system to plot these daily measurements onto paper. As the structure moved across the paper, it eventually returned to my starting point, creating a loop.

Husky
86 x 86 inches, graphite and colored pencil on paper
Over the past several years, I have been recording my daily weight fluctuations. Before beginning this work, I consolidated these recordings in order to eliminate repeat weights. In the drawing, I derived the size of the central circle by averaging my weight for the past 4 years and subtracting the result from my ideal weight (according to the Department of Health). Then, I added up all of the single-digit, common numbers from my weight chart and came up with 42, represented by the finger-like extensions emanating from the circle. The next level of solidly colored leaf-like shapes resulted from another interpretation of my weight changes. Emanating from the concave sections of the red form, the length of each “leaf” equals a specific physical weight multiplied and then divided by others, translated into centimeters. I multiplied or divided according to whether the weight was even or odd / small or large. The colors (cool or warm) also corresponded to those number qualities. The next structural section growing from these leaf-like forms came about after I translated my weights into letters and then into words, via a pocket dictionary. Then, I re-translated the new words back into numbers and plotted them as tentacle-like, looping extensions. Some of the information within these and the other spaces was derived from the following: references to state statistics of obesity and binge drinking; the exact middle sections of anatomy books (diagrams from these pages); the negative spaces in between the circulatory and vascular system; baldness progression diagrams; every word in the thesaurus for fat, with the middle letter removed. The black and white central snowflake shape was the final piece of the drawing. I made it by tracing and then overlapping the negative spaces of various paintings and sculptures from Greek and Renaissance history, such as the Spear Bearer and Michelangelo’s Moses. Lastly, interspersed throughout the work is information pertaining to the systems and processes in the drawing.
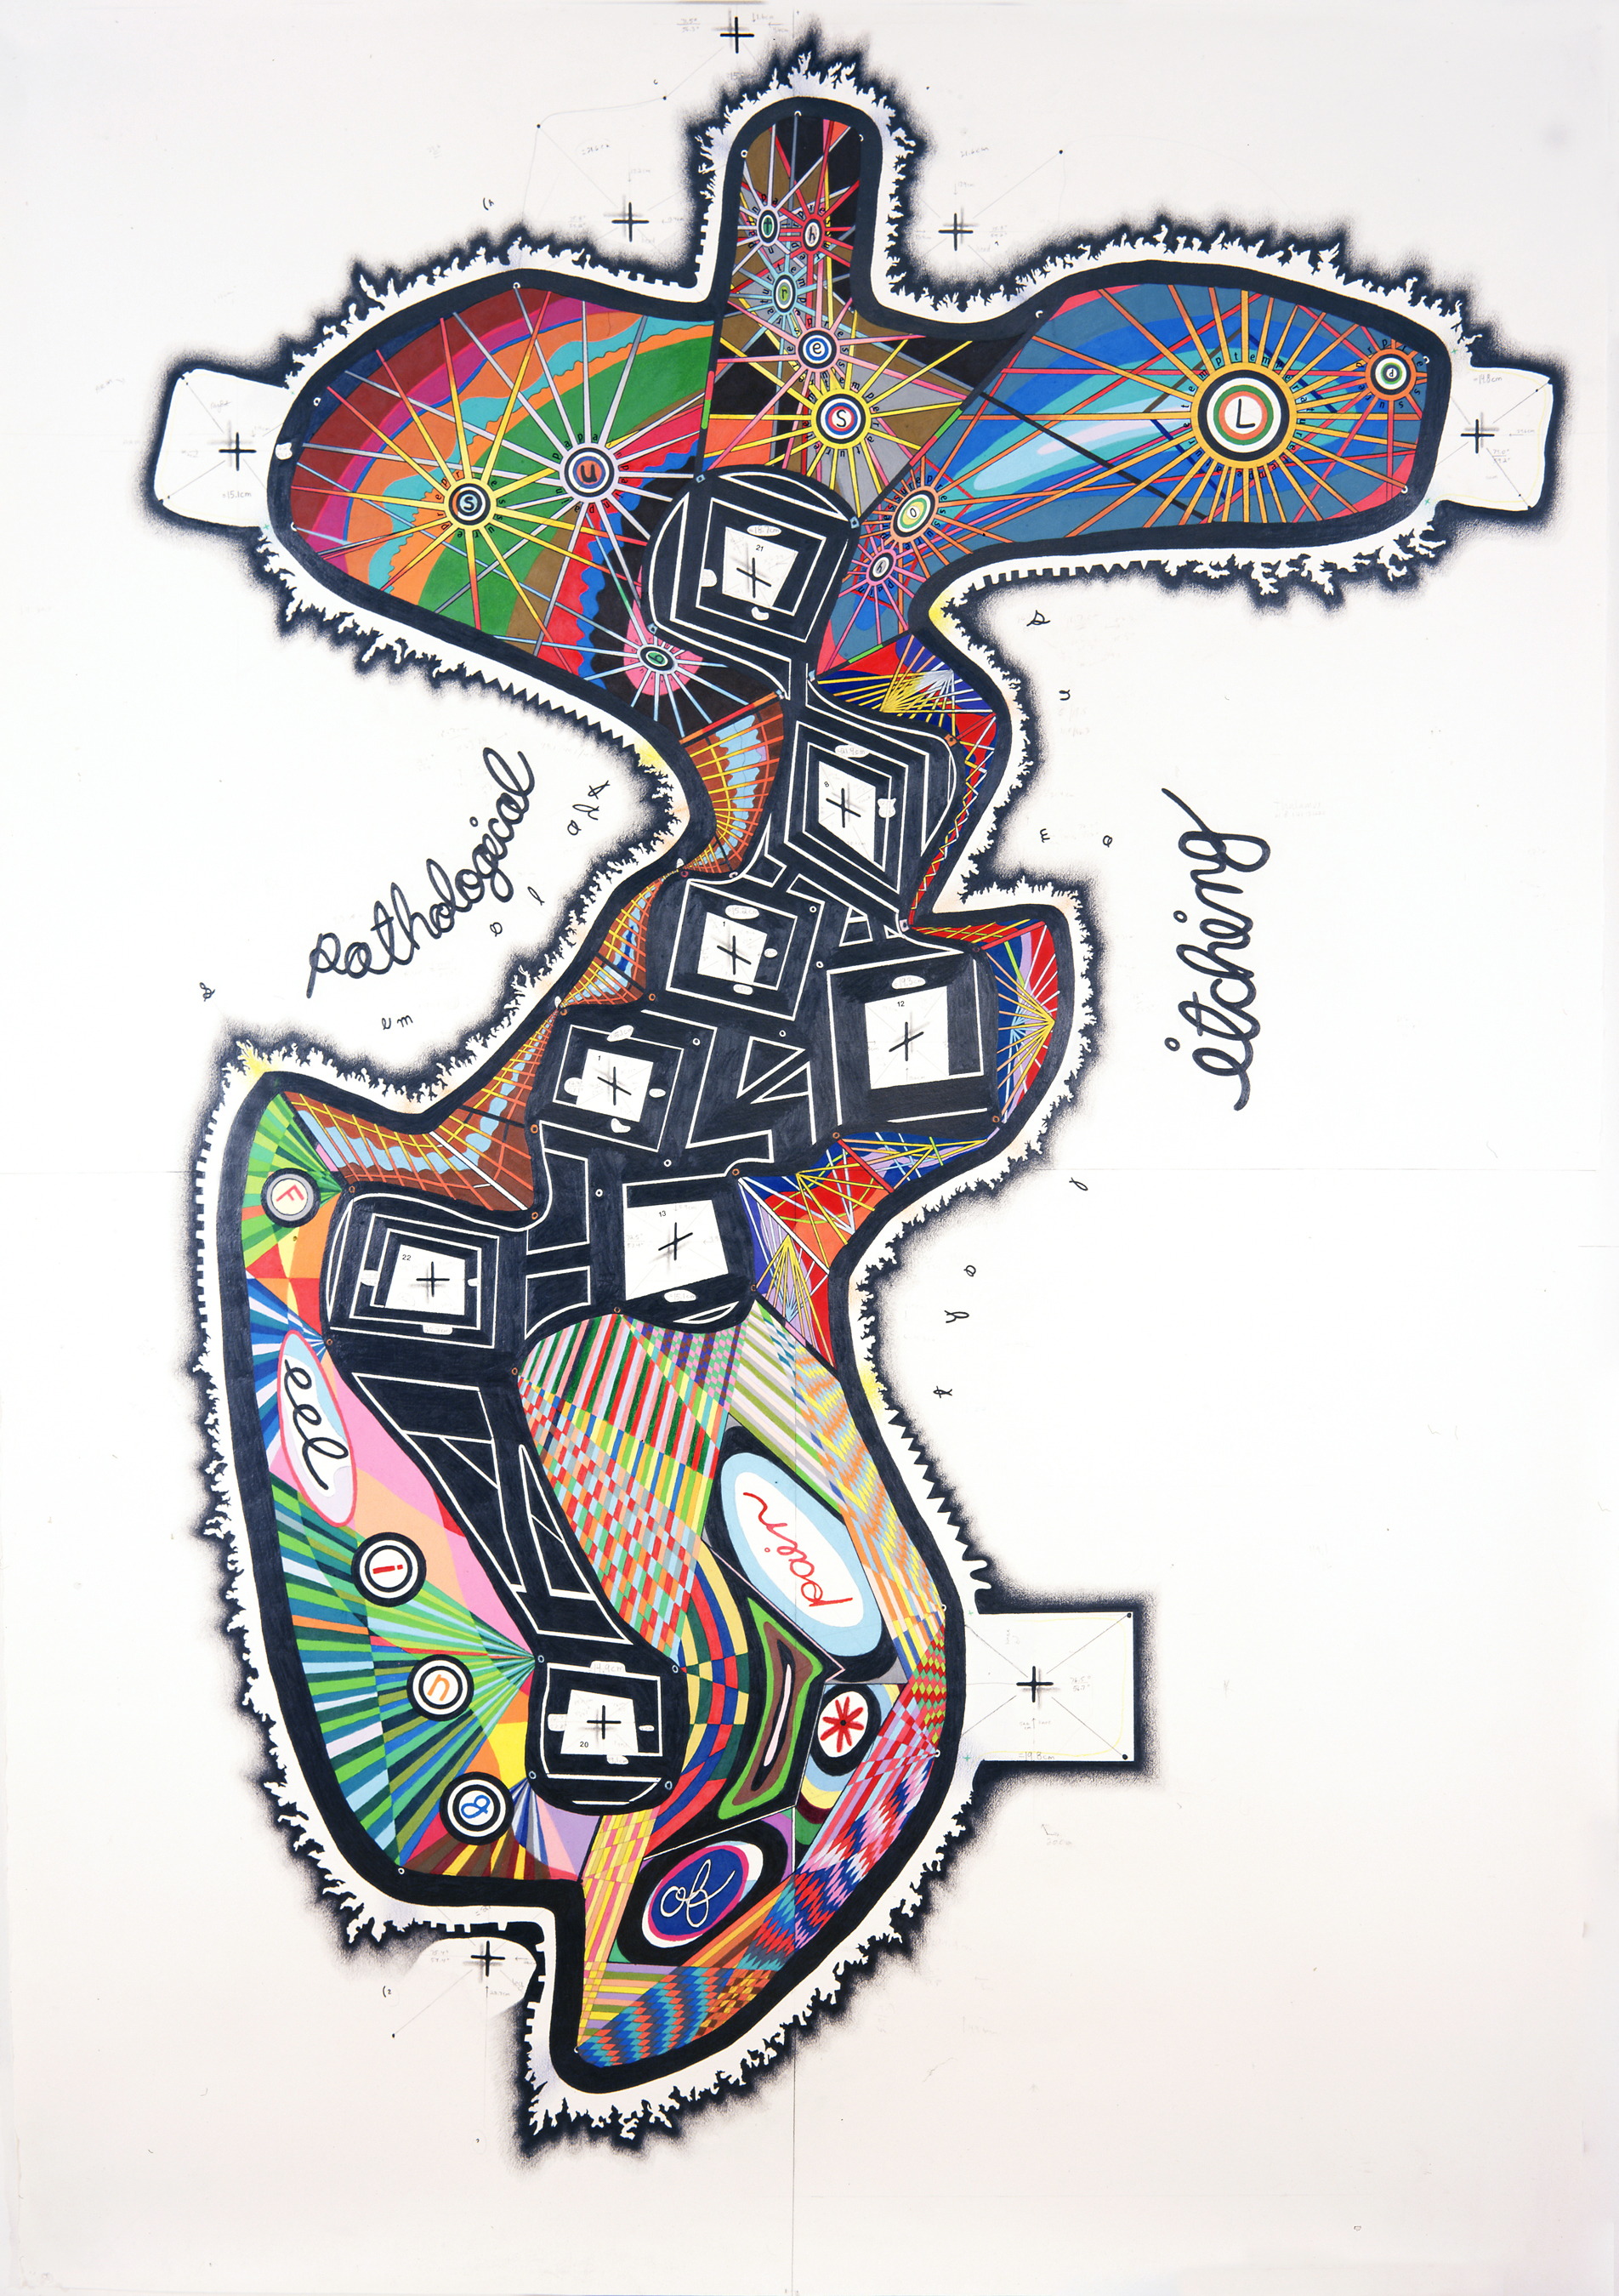
Scratch
74 x 60 inches, graphite and colored pencil on paper
This work began as an investigation into the causes of itching – as a potential result of physical and/or mental stresses. I began by recording when, where, and at what temperature and time I had an itch. At various times, I tried to make myself itch by concentrating on the sensation. I then recorded the points on my body (with a Sharpie) where I felt an itch and then transcribed them to the paper, which was cut to my exact height. The orientation of the “X marks” correspond to the parts of my body (i.e. an X slanted to the right equals an itch on my back, etc.). After noting all the points, I tried to look for and demarcate a pattern. The circular areas, in addition to the lines that differentiate the layers of pattern, are the result of my initial attempts to connect the points – I utilized the “searching” lines as the foundations for the overall structure. In addition, the information I included within the form(s) relates both to current theories of itch sensation and to some of my own conclusions.

Nuzzied
77 1/8 x 71 1/2 inches, colored pencil and graphite on paper
I derived the general shape/structure of Nuzzied after making myself dizzy. I spun around 31 times (my age) and then tried to draw 2 distinct, evenly spaced spirals (symbols of hypnosis): one circular and the other rectangular. A “core” emerged at the center-left, outlined in black – the result of the overlapping of each initial spiral. Within this core, the number of points comprising the central shapes corresponds to different U.S. state statistical averages of obesity and binge drinking. Similarly, throughout the drawing information is transformed and embedded within the initial drawing. I used contrasting formal elements to distinguish between layers of information and to maintain the integrity of the beginning spirals. For example, the number, color and size of various sets of stripes correspond to words and statistics. For this “coding” I incorporated numerous sources such as Oliver Sacks’s writings on balance, medical texts, lottery numbers, and US statistics relating to human “imbalance.” In addition, I made and employed stencils of the borderlines between the US, Canada and Mexico. I also referenced two identical clocks that I set two years ago simultaneously but which now have greatly divergent times. And the random fragments of residual color remaining on the contours guided the direction of the string-like bands surrounding the main form. Overall, my formal and conceptual interests are integrated into a web of balance and imbalance derived from my dizziness.

Drug Loop
88 3/8 x 72 inches, colored pencil and graphite on paper
"O’Connor develops his new works through a circular, or looping, process of one thing leading to another, and back to the beginning. His most recent and largest drawing, “Drug Loop,” reveals the circular effect of popular medications and their side effects. He begins at the top with “headache” and takes as solution, Bayer Aspirin. He then randomly selects from among listed side effects, chooses a new medication to treat the side effect, and so on around a central circular shape-from “no sex drive” to “hyperactivity,” “anxiety,” and, finally, “agitation.” - Susan Swenson (2011) In the center of the drawing, I began by drawing 2 small brain scans, connected - one of a healthy brain, and one with Alzheimer's disease. I then traced the contour of the 2 brains combined, flipped it, and redrew it around the first images. I continued this process of drawing and re-drawing the contours of each successive form, allowing the shape to grow organically, with small, almost imperceptible changes occurring with each phase. It was as if the specific shape of the original scans began to multiply and mutate, almost fractally, and eventually started to invade the medication ring.


Memory Loss
73 X 63 inches, graphite and charcoal on paper